How to Turn Your Social Data into an AI Content Coach

Manually analyzing social media data to optimize your content strategy sounds ideal, but in practice it’s often cumbersome and time‑consuming. You may have tried pulling an Excel report once a month, staring at the numbers, and ultimately deciding what to post next based on gut feeling. I’ve been there—spending hours comparing the performance of different posts, yet struggling to extract any real patterns. Later I realized the problem isn’t a lack of data, but the absence of a system that turns data into action. This article shares a workflow I’ve validated in real‑world operations: first export your social data, then use AI tools to analyze patterns and gaps, and finally let AI act as a coach to adjust your strategy. The system is built entirely on your own data, not on generic industry best‑practice lists.
Step 1: Export Your Social Data
Getting social data is the foundation for building a personalized AI coach. Without your own data, AI suggestions are no different from the “best posting times” lists you can find everywhere. When I managed social media with Buffer, I discovered its Insights feature provides a very straightforward export entry point—click the export button in the upper right, select a date range, and you get a complete CSV file. The whole process takes only a few seconds, and it’s included for free in all plans.
If you’re already comfortable using API tools, you can also have an AI tool fetch the data directly. I connected my Buffer account to Claude and simply said, “Pull all my LinkedIn posts from the past three months, including copy, publish dates, and all engagement metrics.” The AI handled the extraction automatically, saving me the manual download and upload steps. Buffer’s API and MCP both support this direct retrieval method.
Whether you export manually or pull via API, the core goal of this step is simple: gather all your real‑world behavior data from social platforms into one place. This data is the foundation for every subsequent analysis and the prerequisite for the AI coach to truly “know” you.
If you’re interested in how AI distribution tools can integrate with the export workflow, check out this analysis on Why You Need an AI Distribution Tool.
Step 2: Let AI Analyze Your Content Patterns
Once you have the data, the next step is to decide what you want to analyze. There’s no standard answer; it depends on which aspect of your content strategy you’re most curious about. Here are a few dimensions I often use:
- Content Pillars – What you’re actually writing versus what you think you’re writing
- Tone & Style – Consistency of copy style and any accidental deviations from brand voice
- Best/Worst Performing Posts – Which content got the most engagement and which got none
- Format Effectiveness – Differences in performance among plain text, images, videos, and links
- Opening Hooks – Common opening approaches and which ones truly work
- Publish Timing – Alignment between actual posting times and optimal times
- Conversion Impact – Whether posts with clear conversion goals met expectations
Pick two or three dimensions that matter most to you, then give the AI a specific prompt. My typical template looks like this:
Pull all my LinkedIn posts from the past 90 days, including copy, publish dates, and engagement data (reactions, comments, impressions, reach). Analyze the distribution of my content pillars, the consistency of my tone & style, and the common traits of the best‑ and worst‑performing posts. Do not use generic social‑media best practices; base everything solely on my data.
The key is the final constraint: “Only based on my data.” Without it, the AI can easily drift toward universal advice that dilutes the value of the analysis.
After running my own data through this, I discovered two surprising conclusions. First, my content pillars were severely imbalanced—I thought I was spending roughly equal time on “System Building” and “Career Development,” but the data showed “Career Development” posts made up less than 15% of my output. Second, the most personalized, least “strategic” posts actually generated the highest engagement. A simple post about taking a birthday day off earned 104 reactions and 30 comments. These insights would never have surfaced from industry reports alone.
For more ideas on content strategy, see the framework articles on the HubSpot Marketing Blog, but remember that any external framework must ultimately be adapted to your own data.
Step 3: Reflect on Strategy Using the “Keep, Start, Stop” Framework
The analysis report is ready, but data alone won’t turn into action. You need a simple framework to bridge analysis and decision‑making. I recommend the “Keep, Start, Stop” framework—simple yet effective.
With your analysis report in hand, ask yourself three questions:
- Keep – Which practices have proven effective and should continue? For example, a content pillar that consistently performs well, or a format with a higher engagement rate than others.
- Start – What new directions does the data reveal that you haven’t tried yet but are worth exploring? For instance, you might notice that video reach is three times that of text posts, yet you only posted two videos in the past three months.
- Stop – Which low‑ROI activities should be dropped decisively? For example, a pillar with almost zero interaction, or a recurring column whose metrics have been declining.
You can dig deeper with follow‑up questions:
- Are there biases in your content pillars? How big is the gap between what you’re doing and what you want to do?
- Is your publishing schedule optimal? You may habitually post on Monday mornings, but data shows your audience is most active on Wednesday evenings.
- Do you need to adjust formats? You might be posting many images, yet the data indicates that link posts have higher click‑through rates.
For insights on optimizing publishing times, see this analysis on LinkedIn Best Posting Frequency, which offers data‑driven references.
This reflection step is crucial for turning data into actionable strategy. Without it, the report remains a collection of numbers with no real impact on your content plan.
Step 4: Let AI Become Your Content Coach
With analysis results and reflection conclusions in hand, the next step is to align them with your social goals and let AI truly act as a coach. You’ll need a more comprehensive prompt that feeds both the goal and the data to the AI.
My prompt template looks like this:
Here are my LinkedIn goals for this year: [your goal, e.g., “increase brand awareness by 30%” or “generate 50 qualified leads per month”]. You have already analyzed my actual publishing data from the past 90 days. Now, as my content coach, based on this data, tell me what adjustments I need to make to achieve my goals. Provide 3‑5 specific, actionable recommendations.
AI suggestions typically include adjusting content pillar ratios, trying new format mixes, optimizing publishing windows, etc. Their uniqueness lies in the fact that they’re derived from your own historical data, not copied from textbooks. For example, the AI might say, “Your ‘System Building’ posts have twice the engagement rate of ‘Industry News’ posts, but you publish ‘Industry News’ three times more often. Reduce the proportion of ‘Industry News’ by 20% and reallocate those resources to produce more ‘System Building’ content.”
With these recommendations, the next step is to plan a concrete publishing schedule. For that, you need a tool that turns strategy into actual publishing actions. I use Flownib, which lets me create content once and automatically distribute it across multiple platforms, eliminating the tedious copy‑and‑paste process. For example, based on the AI coach’s advice, I decided to add two “System Building” posts next week and drop one “Industry News” post. I just write the content in Flownib, and it automatically adapts to each platform’s format and character limits, then publishes at the scheduled times.
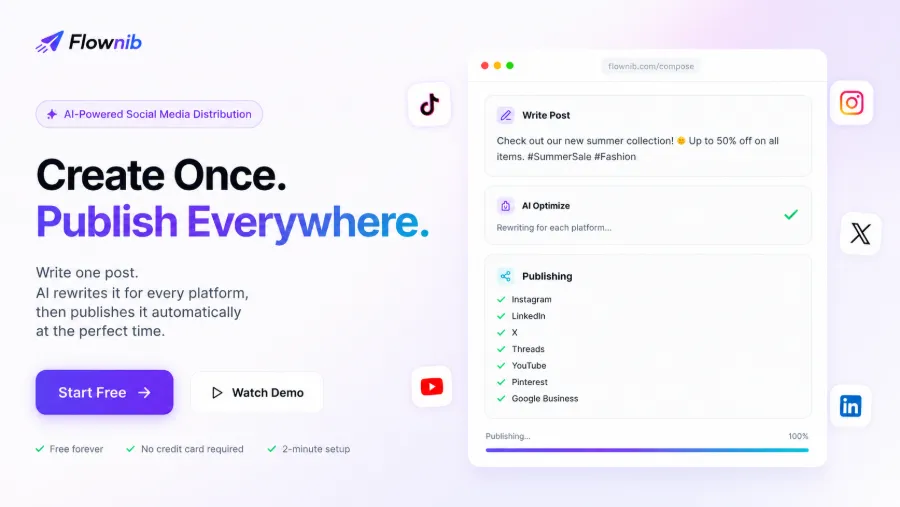
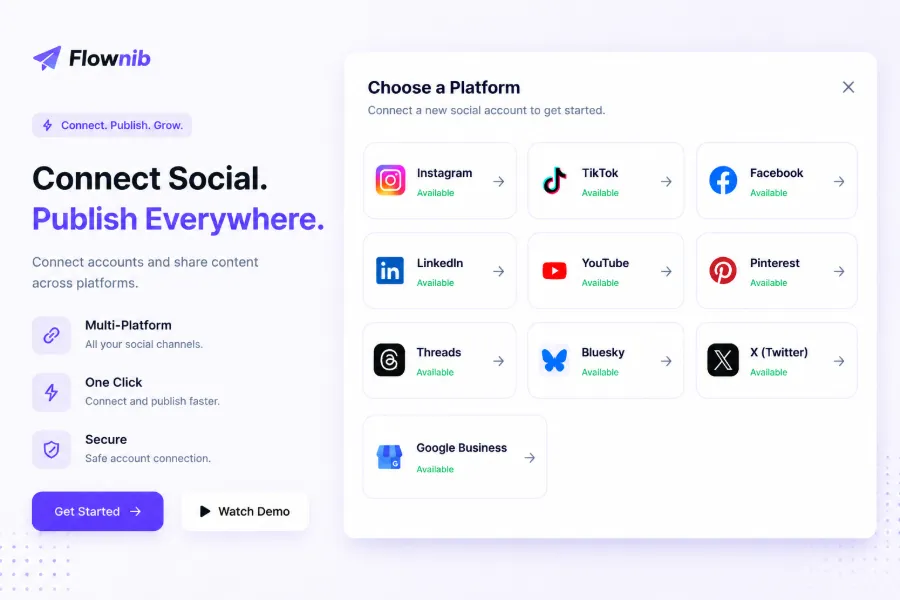
Flownib supports Instagram, X, LinkedIn, Threads, YouTube, Pinterest, Google Business, and 10 other social platforms, covering the major channels today. If you need to manage multiple platforms simultaneously, this tool can dramatically reduce repetitive publishing work.
The closed‑loop workflow looks like this: Export data → AI analysis → Strategy reflection → AI coach recommendations → Flownib execution → Next round of data export. Each cycle brings your content strategy closer to “data‑driven decision making.” For a discussion on how automated workflows integrate with social media, see this article on Why Automated Workflows Need Social Media.
FAQ
Q1: Does this workflow require paid tools?
No. Buffer’s Insights export feature is free across all plans. You can use a free AI tier—Claude’s free quota is sufficient for a single analysis. Flownib offers a free tier that includes 3 social accounts and 6 posts, enough to test the whole workflow.
Q2: Is my data safe? Will AI see my social data?
If you use Buffer’s CSV export, the data never leaves your local computer; you can choose not to upload it to any cloud AI service. If you let an AI fetch data via API, use a service with a clear privacy policy and avoid including sensitive information in prompts. Generally, publicly posted social media content isn’t highly sensitive.
Q3: What if the analysis results are inaccurate?
First, check that your data range is large enough—samples under 30 posts rarely yield reliable conclusions. Next, ensure your prompt includes the “Only based on my data” constraint. If results are still unsatisfactory, try a different analysis dimension or manually verify the AI’s conclusions against your intuition. AI analysis is valuable for uncovering overlooked patterns, not for replacing your judgment.
Q4: How often should I perform this analysis?
I recommend a full analysis once a month, or after every 50 posts. Too frequent (e.g., weekly) data fluctuations are too volatile to form meaningful conclusions; too infrequent (e.g., semi‑annually) may cause you to miss optimal timing for strategy adjustments.
Q5: Does this method work for all social platforms?
It works for any platform that can export structured data. Buffer currently supports LinkedIn, X (Twitter), Instagram, Facebook, and other major platforms. If your platform isn’t supported, you can manually collect data and format it as CSV, then run the same workflow.
Share Article