Data Fragmentation Is the Biggest Enemy of Social Media Strategy

You’re running four or five social platforms at the same time, spending a lot of time each month switching back and forth in the backend to check data, yet you still can’t pinpoint which piece of content actually drives growth. This fragmented state not only drains energy but also makes you miss the decision‑making value that should be extracted from the data. This article doesn’t list tools; instead, it breaks down how data silos arise, how third‑party analytics solve the problem, and how to close the execution loop after analysis.
A painful reality is that many teams spend two hours analyzing data, only to conclude “post on Tuesday at 3 p.m.” but when it comes time to execute, they still have to manually copy‑paste into four platforms, missing the optimal time window. Data fragmentation has never just a data issue—it ultimately gets stuck in the execution workflow.
Why Native Analytics Tools Aren’t Enough
LinkedIn Analytics doesn’t show timestamps for past posts, meaning you can’t look back at the best posting times over the last three months. Instagram Insights’ export function is extremely limited; cross‑platform comparisons can only be done by screenshots and manually stitching together Excel files. X Analytics defines metrics completely differently from Instagram, so you can’t equate the “engagement rate” across the two platforms.
The most embarrassing experience I’ve had: we were running LinkedIn, Instagram, and X simultaneously, and the team spent an hour every Monday morning pulling last week’s data, then another half‑hour manually reconciling tables. Three months later, a review revealed that LinkedIn’s optimal posting time had shifted from Wednesday morning to Thursday afternoon, but because the native tool doesn’t show historical timestamps, we never noticed. It wasn’t until we imported a third‑party tool that we saw a clear trend line—by which time we had spent three whole months posting at the wrong times.
For teams managing more than three accounts, manual cross‑platform data pulls waste an average of 6–8 hours per month. That doesn’t even account for judgment errors caused by inconsistent data definitions. Native tools are designed to serve a single platform’s operations, not to help you make global, cross‑platform decisions.
How Third‑Party Analytics Tools Help You Break the Silos
A unified dashboard aggregates data from all platforms onto a single screen, so you no longer have to jump back and forth. Most mid‑range third‑party analytics tools cost $49–$100 per month, which is a high ROI for teams with limited budgets—spending that amount saves you half a day each week.
Take Rival IQ as an example; it not only pulls your own data but also captures publicly available metrics from competitors. Keyhole does a good job with topic tracking and campaign analysis, making it suitable for campaign‑level post‑mortems. Socialinsider’s story‑set analysis is worth mentioning—it can break down performance by content format, such as Stories vs. Feed Posts. Buffer’s analytics module leans toward simple daily monitoring, ideal for small teams that want quick trend insights.
But there’s a trap: more tools aren’t always better. I’ve seen a team subscribe to three analytics tools at once, yet each platform’s data definitions still differed—some counted “reach,” others counted “impressions,” which added an extra layer of alignment cost. Choose the one that covers the platforms you actually use, and that’s enough.
If you want to explore which tool combinations are worth considering, read our article on the 2026 Best AI Social Media Management Tools (https://flownib.com/p/insights/10-best-ai-social-media-management-tools-in-2026-compared-ranked/index), which provides detailed comparisons by use case.
After You Have the Data, Execution Is the Real Bottleneck
Analysis can tell you the “best posting time” and the “most popular content type,” but execution still has to be done manually—if the analysis system says the window is Tuesday at 3 p.m., you still need to open four backends at 2:30 p.m. on Tuesday and paste the content one by one.

This “analysis → publishing” loop break is the real reason many teams’ data strategies fail. At my previous company, the team produced a weekly data report every Friday that listed the optimal posting time and content type for the following week, but the ops team would toss the report aside on Monday and post manually according to their own habits. The data never translated into action.
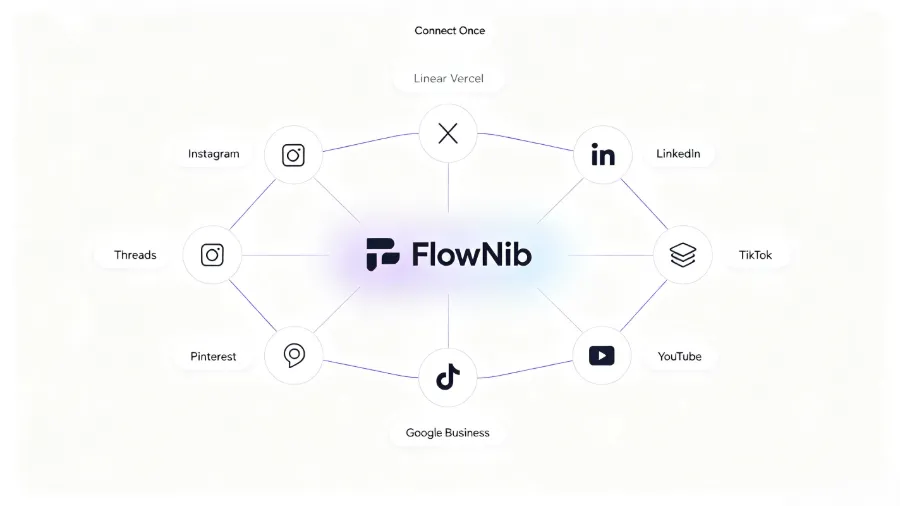
Tools like Flownib (https://flownib.com) fill this gap: you still need to spend time in the analysis phase to find direction, but on the execution side, AI can automatically rewrite content according to your preset strategy and schedule it for each platform, reducing manual handling time per post from 3–5 minutes to under 30 seconds. For building the entire workflow, see our AI‑Powered Social Media Automation Workflow (https://flownib.com/p/local/en/flownib-ai-powered-social-media-automation-platform/index.html).

The specific pain points of manual cross‑platform publishing are also discussed in detail in the Hootsuite Blog (https://blog.hootsuite.com/) under cross‑platform marketing strategy articles. The core conclusion is consistent: manual operation is the efficiency bottleneck and the break in the data loop. We ran a comparative test, results posted in Manual Publishing vs. AI Distribution Efficiency Comparison (https://flownib.com/blogs/5d90855d-57be-4a00-b32c-5ad9694a32d7)—the conclusion was that automation can shrink the total time to publish a piece of content across four platforms from 15 minutes to under 20 seconds.
Building a True Data Loop
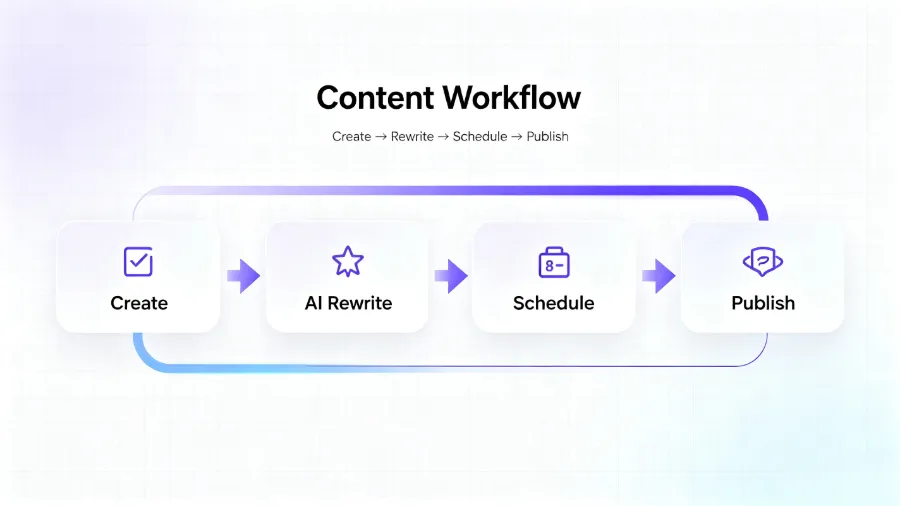
With a unified data dashboard and an automated publishing tool, the next step is to make them truly mesh: data insights → content strategy → scheduling → automated distribution → performance feedback → strategy adjustment. Only when this cycle runs smoothly is the fragmentation problem truly solved.
Specifically, I recommend this workflow: every Monday, spend 20 minutes reviewing the previous week’s data cards generated by the third‑party tool, identify the best‑performing content types and time slots, then directly update next week’s publishing schedule with that information. Once the schedule feeds into the publishing tool, AI automatically rewrites the content for each platform’s specs and pushes it at the scheduled times. When you review the data over the weekend, you’ll clearly see the impact of the strategy adjustments.
The concept of a content loop sounds simple, but in practice it requires several independent tools to work together. We have an article titled Content Closed Loop: Three Independent Tools (https://flownib.com/p/insights/content-closed-loop-is-the-new-standard-a-look-at-seonib-veonib-and-flownib/index) that explains how analysis tools, content rewriting tools, and distribution tools can coordinate. For small teams, a tool like Flownib can help implement the strategy because it bundles rewriting, scheduling, and publishing, eliminating the need for intermediate hand‑offs.
FAQ
Q1: What information do you miss if you rely only on native platform analytics?
Mainly historical trends and cross‑platform comparisons. LinkedIn doesn’t show past timestamps, Instagram Insights can’t export by content format in bulk, and X Analytics defines engagement differently from Facebook. You’ll struggle to see “how the same piece of content performs differently across platforms” and can’t retroactively assess whether a three‑month‑old posting strategy is still valid.
Q2: Are third‑party analytics data accurate, or do they mismatch with platform backends?
There are minor discrepancies, usually within 5 %, caused by differences in data pull timing and API latency. These deviations don’t affect trend judgments—you care about “whether engagement rate has risen or fallen over three weeks,” not that “Monday had exactly three more likes.” Choosing a tool that connects via the official API reduces the variance.
Q3: What if the analysis is solid but execution can’t keep up?
Feed the analysis results directly into the publishing schedule. If manual operations take too long, consider an automation tool to handle rewriting and publishing. Many third‑party analytics tools don’t include publishing, so you’ll need a separate distributor to fill that gap.
Q4: Do small teams really need to purchase a third‑party analytics tool?
Yes, but it doesn’t have to be expensive. A $49‑per‑month tool can cover core metrics for 3–5 platforms. The time saved (6–8 hours per month) far outweighs the cost. If budget is tight, start with the free tiers of Buffer or Social Status.
Q5: Are there tools that do both analysis and publishing?
Most tools specialize in one side—analysis tools don’t publish, and publishing tools don’t analyze. Platforms like Hootsuite offer both but lack the depth of dedicated analytics. The current market solution is to combine an analysis tool with a publishing tool, or use something like Flownib, which focuses on publishing but includes basic analytics views, and pair it with a deeper analytics solution.
Share Article