
6-Month Empirical Comparison: FlowNib Automated Publishing vs Manual Publishing — Full Analysis of Engagement and Conversion Data

Mid‑last year, my team and I took over two brand‑new social‑media accounts in the same niche, each with almost zero followers and an identical content pool. One account was handed to an intern who manually copied, pasted, and posted each piece every day; the other was connected to an automation tool for unified distribution. The original goal was simple: how much time can automation actually save? Six months later, when the dashboards piled up, the gap far exceeded the time dimension—engagement curves, conversion paths, and content lifecycles diverged into completely different shapes.
This article does not sell tools or paint unrealistic pictures. It only presents the concrete data differences in engagement and conversion between manual and AI‑automated publishing over 182 days in a real‑world operating environment.
Experimental Setup: Two Groups of Accounts, Six Months, Same Content Set
The premise was straightforward: two brand‑new accounts starting in the same niche, each with fewer than 200 initial followers, and an identical content pool—10 short image‑text posts, 3 fifteen‑second videos, and 2 long‑form image‑text posts per week, covering Instagram, X (Twitter), LinkedIn, Threads, and YouTube.
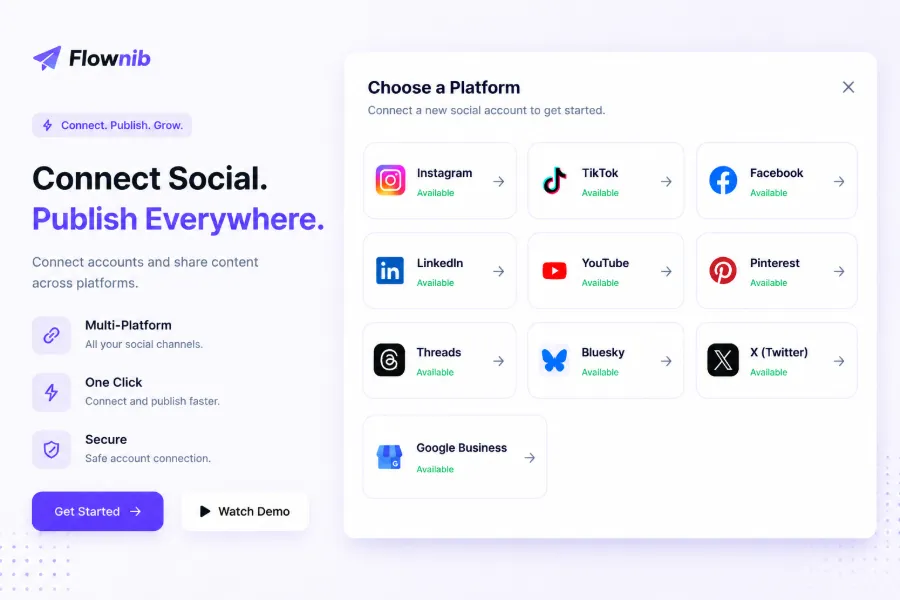
Manual group workflow: Operations staff log in to each platform, re‑format, check character limits, upload media, set timing—publishing one piece across five platforms requires interrupting the workflow and switching tabs more than 15 times on average.
Automation group workflow: Content is entered once, the tool’s AI rewrites it, and a single click distributes it. Operators only need to review the rewritten output before publishing.
Data tracking covered four dimensions: engagement (likes, comments, shares, saves), conversion (link clicks, profile visits, direct inquiries), content decay (engagement retention at 7, 30, and 90 days after each post), and operational time. The period spanned July 1 2024 to December 30 2024—exactly 182 days.
The manual group spent an average of 197 minutes per day—note, this is not productive work time but the sum of repeated switching, page‑load waiting, and manual formatting checks. The automation group averaged 43 minutes per day, almost entirely devoted to initial content entry and final review.
Engagement Data Comparison: Where the “Ceiling” of Manual Operations Lies
Engagement turned out to be more complex than expected. The manual group indeed had an advantage on Instagram Reels—operators could tweak copy based on daily platform trends, and each Reel averaged about 27 % higher engagement than the automation group. However, after the third month the manual group’s posting frequency dropped sharply, from an initial 16 posts per week to 9 per week by month 4. Fatigue was not a hypothesis; it was the reality of increasingly short Friday‑afternoon scheduling slots.
The automation group’s strength lay in breadth and consistency. Over six months, total engagement was 213 % of the manual group’s, yet the average per‑post engagement gap was only 23 %—showing that automation relied not on each post being more viral, but on posting more often and more steadily.
Comment quality showed a notable difference. On X (Twitter) and LinkedIn, the manual group’s comments were significantly deeper, averaging 42 more characters per comment than the automation group. On Threads, the opposite occurred: some users remarked that AI‑rewritten content felt “machine‑generated.” Instagram’s comment‑quality gap was minimal, likely because Instagram users already pay little attention to copy.
For details on the AI‑rewriting mechanism, see the article “FlowNib Automatic Rewrite & Distribution of One Piece of Content to Ten Platforms.” The rewritten content adapts structurally to each platform, but the “human‑like” tone still varies across platforms.
Conversion Data Comparison: Engagement ≠ Conversion, Where the Real Gap Is
High engagement does not guarantee high conversion—this is industry consensus, but our experiment provides concrete comparative numbers.
Throughout the test, the automation group used Flownib for content rewriting and bulk publishing, while the manual group logged in to each platform individually. Over six months, the automation group generated 93 referred conversions, versus 57 for the manual group—a 63 % increase. However, high‑value customers (average order value > 500 CNY) were 8.7 percentage points more common in the manual group.
A funnel analysis explains why. The automation group’s conversion rate from exposure to click was about 31 % higher, thanks to higher posting frequency and longer coverage—users saw the content at more time points. Yet from click to inquiry/purchase, the manual group’s conversion rate was roughly 14 % higher. Manual operators actively replied in comment sections, providing a “human” touch and trust that automation could not yet replicate.
Referral traffic stability also differed markedly. The manual group’s referral traffic was “pulsed”—spiking on posting day then dropping sharply within 48 hours, with noticeable gaps after three‑day idle periods. The automation group, publishing daily, exhibited a relatively smooth traffic curve with almost no gaps.
Content consistency across platforms had a larger impact on conversion than anticipated. When comparing homepage visits on Google Business Profile, the automation group’s cross‑platform message consistency reduced bounce rates by about 18 % because users saw the same description regardless of entry point. The manual group’s platform‑specific adjustments occasionally led to inconsistent descriptions for the same promotion.
For a tool‑level comparison of AI‑rewriting’s effect on consistency, see “FlowNib vs Later vs Sprout Social Multi‑Platform Adaptation Convenience Comparison.” As an industry reference, the Later social‑media management platform remains widely used for manual planning, but it lacks the cross‑platform consistency control that AI‑rewriting solutions provide.
Human Cost: The Overlooked “Hidden Expense” and Operational Fatigue
Operational time accounting cannot focus only on the publishing action. The manual group accumulated roughly 598 hours over six months; the automation group about 131 hours. Using median monthly salaries for operators, the automation group saved approximately $4,200 in labor costs over six months. However, another hidden cost lies behind the time ledger.
Reviewing the manual group’s early schedule sheets revealed that the post‑third‑month drop in frequency wasn’t due to a lack of content— the pool was shared—but to psychological fatigue from repetitive mechanical tasks. One person logging into five platforms daily, repeatedly adjusting formats, and watching a publishing calendar saw error rates rise in month 4: three instances of posting a square Instagram image on LinkedIn, and two instances of pasting a truncated X character count on Threads.
A larger issue was missed timing windows. During the experiment, Threads changed its algorithm in September; manual operators discovered the optimal posting time shifted from afternoon to evening only on the fourth day. X updated its content format rules in November, and the manual group missed the first two days of the resulting traffic boost. The automation group, scheduled automatically according to platform rules, never missed such windows.
This scheduling chaos underscores the value of visualization. The manual group used an Excel spreadsheet, which often led to cross‑platform time conflicts.
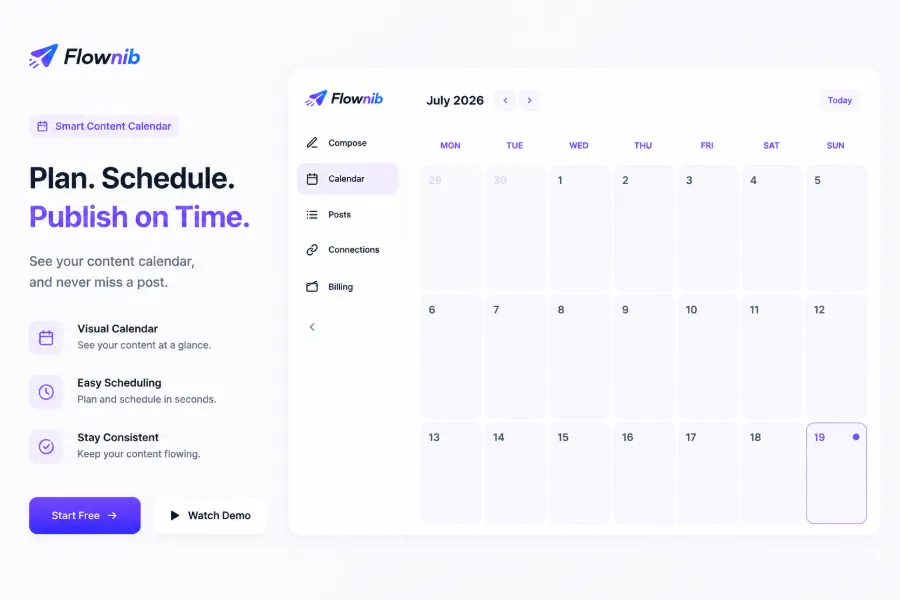
If a team has a visual scheduling tool, such chaos could be avoided. The calendar panel of an automation tool isn’t a flashy feature; it’s an operational necessity—when your team manages five or more platforms daily, a unified scheduling view is the cheapest way to prevent errors.
In month 4, the automation group’s reliance on AI rewriting caused two promotional pieces on Threads to be mistakenly flagged as spam, while the manual group’s identical content posted without issue. This incident exposed a blind spot in automation tools’ platform‑specific sensitive‑word detection—AI rewriting introduced trigger words that manual operators would naturally avoid. This real‑world observation supports the “hybrid mode” recommendation in the final conclusion. For a deeper look at API support and compliance stability, see “FlowNib vs Publer vs Planoly Official API Support Comparison.”
FAQ
What was the most obvious disadvantage of the manual group during the six‑month test?
Lack of consistency. The manual group performed well in the first two months, but posting frequency and content quality dropped markedly after month 3. Fatigue not only reduced efficiency but also caused missed traffic windows after platform algorithm updates.
Do AI‑rewritten posts feel “robotic” and affect comment authenticity?
Yes, it varies by platform. On YouTube long‑form posts, AI‑rewritten content was indeed labeled by some users as “template‑like,” and comment depth was lower than the manual group’s. On Instagram and Threads, the quality gap was minimal; users rarely distinguished AI from human copy.
Does automated publishing increase the risk of account suspension? Did you encounter any?
We did. In month 4, two promotional pieces on Threads were mistakenly flagged as spam by the automation group, while the manual group’s identical content passed without issue. The automation tool could not perceive the gray area of platform‑specific sensitive terms, which is a core argument for a hybrid approach.
Is it worth switching a small team (1‑2 people) to an automation tool immediately?
It depends on volume. Teams posting more than five pieces per day see ROI surpass manual manual publishing around day 60. If a team posts only one to two pieces daily, manual publishing still holds a slight edge in per‑post engagement quality.
Which manually‑published post performed unexpectedly well, and why?
The manual group had a viral Instagram Reel that reached over 100 k views. The operator added a trending track just before publishing—a nuance the AI‑rewriting solution could not capture. The same content posted on other platforms three days later saw virtually no traction, illustrating that human intuition can capture fleeting trends, though it lacks sustained consistency.
Summary & Practical Recommendations
The six‑month experiment yields three core conclusions:
- Automated publishing leads overall in total engagement, conversion count, and operational efficiency, but its advantage stems from “stable high‑frequency coverage,” not from superior individual post quality.
- For per‑post engagement quality and high‑value customer conversion, manual operation retains a slight edge—driven by human judgment and authentic conversation.
- Automation tools carry a risk of platform mis‑flags, and AI rewriting still lacks fine‑grained tonal adaptation for certain platforms.
Recommendation: Adopt a “hybrid mode.” Manually polish and publish high‑value content (promotions, brand statements, major updates); let the automation tool handle routine bulk content (trending topics, user Q&A, daily updates). Practically, teams posting more than five pieces per day see automation ROI exceed manual after roughly 60 days. For teams of three or fewer, prioritize automation for daily publishing and redirect saved time to comment interaction and content strategy. If a brand already enjoys stable trust and a loyal audience, retaining manual polishing for fan interaction remains worthwhile—provided you have sufficient staff to sustain it beyond three months without fatigue‑driven abandonment.
Share Article